This probe is available from Cayman Chemical [(+) and (-)], Sigma [(+) and (-)] and Tocris [(+) and (-)]
Racemic mixtures are available from Sigma (+/-) and BPSBioscience (+/-). The concentration of the active ingredient, (+)-JQ1 should be readjusted.
| Probe | Negative control | |
 |  | |
(+)-JQ1 / (+)-SGCBD01 |
| (-)-JQ1 / (-)-SGCBD01 |

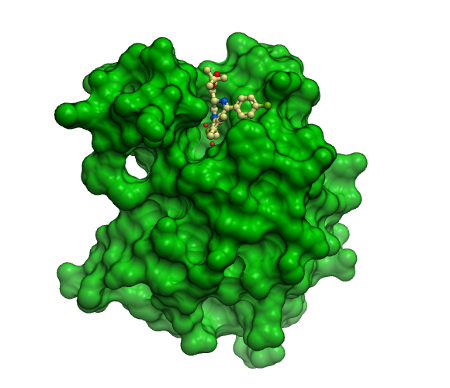
Co-crystal structure of (+)-JQ1/(+)-SGCBD01 in complex with the first bromodomain of BRD4. The inhibitor is shown in ball and stick representation and as transparent cpk demonstrating good shape complementarity to the BRD4 acetyl lysine binding site.
| Bromodomain | K d/nM (ITC) | IC 50/nM (alpha screen) | Tm shift °C |
|---|---|---|---|
| BRD2 (N) | 128±6.5 | 17.7 ± 0.7 | 6.5 ± 0.1 |
| BRD2 (C) | NT | NT | 8.0 ± 0.01 |
| BRD3 (N) | 59.5 ± 3.1 | NT | 8.3 ±0.1 |
| BRD3 (C) | 82.0 ±5.3 | NT | 8.4 ± 0.01 |
| BRD4 (N) | 49.0 ± 2.4 | 76.9 ± 1.7 | 9.4 ± 0.07 |
| BRD4 (C) | 90.1 ± 4.6 | 32.6 ± 1.8 | 7.4 ± 0.1 |
| BRDT (N) | 190.1 ± 7.6 | NT | 3.9 ± 0.1 |
| BRDT (C) | NT | NT | NT |
| CREBBP | ND | 12942 ± 640 | 1.0 ± 0.1 |
(nt=not tested, nd=not detected)
Shown are binding constants determined by isothermal titration calorimetry (ITC), IC50s determined by a KAc displacement assay (alpha screen) and temperature shift (Tm) data.
Tm shift vs 37 bromodomains all <1°C except BET subfamily, CREBBP (1.2°C) and WDR9 (1.8°C)
The racemic mixture was found to be inactive vs 55 receptors and ion channels (CEREP panel, including benzodiazepine GABA A receptor) at 1µM, except adenosine A3 (61%) & NK2 (56%). Inactive vs 6 lysine methyl transferases up to 100 µM.

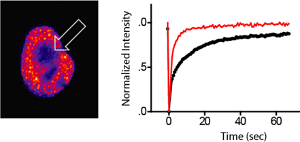
Fluorescence recovery after photobleaching (FRAP): The panel on the left shows a GFP-BRD4 fluorescent nucleus. The arrow indicates the zone of bleaching. GFP-BRD4 showed significantly quicker recovery in the bleached zone when treated with 500nM JQ1 (right panel).

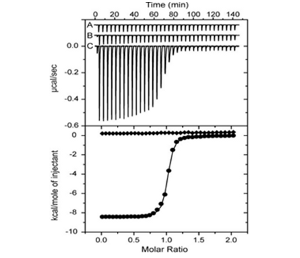
Isothermal titration calorimetry (ITC): The upper panel shows raw injection heats for blank titration of BRD4 into buffer (A), into inactive (-)-JQ1/(-)-SGCBD01 (B) and active (+)-JQ1/(+)-SGCBD01 (C). Normalized binding isotherms are shown in the lower panel for (-)-JQ1/(-)-SGCBD01 (squares) and (+)-JQ1/(+)-SGCBD01 (spheres).
Bromodomains are protein interaction modules that selectively recognize e-N-acetylated lysine residues (Kac). This recognition process is the molecular basis of the "reading process" of epigenetic acetylation marks. In the human proteome there are 41 diverse proteins containing 57 bromodomains which share a conserved ford of left-handed helical bundles. This arrangement creates a deep largely hydrophobic acetyl lysine binding cavity which constitutes an attractive pocket for the development of selective protein interaction inhibitors. The human BET family (BRD2, BRD3, BRD4 and BRDT) which all contain two conserved bromodomains per target, plays a key role regulating transcription of growth stimulating genes. In collaboration with the laboratory of James E. Bradner we developed a potent, cell permeable and selective inhibitor for BET bromodomains ((+)-JQ1) and evaluated its role in NUT midline carcinoma, an aggressive incurable cancer that is genetically define by a chromosomal translocation of BRD4 with NUT (Nuclear protein in testis). Details of this study have been published in Nature (doi:10.1038/nature09504).
 |
[(S)-4-(4-Chloro-phenyl)-2,3,9-trimethyl-6H-1-thia-5,7,8,9a-tetraaza-cyclopenta[e]azulen-6-yl]-acetic acid tert-butyl ester |
| Physical and chemical properties | |
|---|---|
| Molecular weight | 456.1 |
| Molecular formula | C23H25ClN4O2S |
| IUPAC name | [(S)-4-(4-Chloro-phenyl)-2,3,9-trimethyl-6H-1-thia-5,7,8,9a-tetraaza-cyclopenta[e]azulen-6-yl]-acetic acid tert-butyl este |
| logP | 4.0 |
| PSA | 53.7 A |
| No. of chiral centres | 1 |
| No. of rotatable bonds | 5 |
| No. of hydrogen bond acceptors | 6 |
| No. of hydrogen bond donors | 0 |
| Storage | Stable as solid in the dark at -20°C. NB making aliquots rather than freeze-thawing is recommended |
| Dissolution | Soluble in DMSO at least up to 10mM |
| DSF Assay | (-)JQ1 | (+)JQ1/SGCBD01 | ||
|---|---|---|---|---|
| Protein | ΔTm | STD | ΔTm | STD |
| ASH1L | 0.00 | 0.00 | 0.00 | 0.00 |
| ATAD2 | 0.31 | 0.23 | 0.18 | 0.68 |
| BAZ2B | 0.00 | 0.00 | 0.00 | 0.00 |
| BRD1 | 0.59 | 0.73 | 0.00 | 0.00 |
| BRD2/1 | 0.89 | 0.60 | 6.47 | 0.09 |
| BRD2/2 | 0.91 | 0.06 | 7.97 | 0.01 |
| BRD3/1 | 1.95 | 0.23 | 8.27 | 0.11 |
| BRD3/2 | 2.14 | 0.47 | 8.39 | 0.01 |
| BRD4/1 | 1.12 | 0.09 | 9.35 | 0.07 |
| BRD4/2 | 0.21 | 0.11 | 7.44 | 0.14 |
| BRD9 | 0.00 | 0.00 | 0.00 | 0.00 |
| BRDT/1 | 0.38 | 0.02 | 3.93 | 0.13 |
| BRPF1 | 0.76 | 0.18 | 0.00 | 0.00 |
| CECR2 | 0.00 | 0.00 | 0.00 | 0.00 |
| CREBBP | 1.18 | 0.21 | 1.04 | 0.11 |
| EP300 | 0.46 | 0.22 | 0.07 | 0.21 |
| FALZ | 0.00 | 0.00 | 0.00 | 0.00 |
| GCN5L2 | 0.00 | 0.00 | 0.00 | 0.00 |
| KIAA1240 | 0.14 | 0.22 | 0.05 | 0.28 |
| LOC93349 | 0.00 | 0.00 | 0.00 | 0.00 |
| PB1/1 | 0.00 | 0.00 | 0.00 | 0.00 |
| PB1/2 | 0.48 | 0.11 | 0.00 | 0.00 |
| PB1/3 | 0.98 | 0.01 | 0.79 | 0.05 |
| PB1/5 | 0.37 | 0.25 | 0.00 | 0.00 |
| PB1/6 | 0.00 | 0.00 | 0.00 | 0.00 |
| PCAF | 0.00 | 0.00 | 0.00 | 0.00 |
| PHIP/2 | 0.00 | 0.00 | 0.00 | 0.00 |
| SMARCA2 | 0.95 | 0.04 | 0.93 | 0.02 |
| SMARCA4 | 0.60 | 0.18 | 0.15 | 0.10 |
| SP140 | 0.69 | 0.80 | 0.00 | 0.00 |
| TAF1/2 | 0.56 | 0.04 | 0.28 | 0.05 |
| TAF1/3 | 0.33 | 0.03 | 0.50 | 0.04 |
| TAF1L/2 | 0.00 | 0.00 | 0.04 | 0.04 |
| TAF1L/3 | 0.14 | 0.18 | 0.00 | 0.00 |
| TIF1 | 0.00 | 0.00 | 0.00 | 0.00 |
| TRIM28/4,5 | 0.00 | 0.00 | 0.00 | 0.00 |
| WDR9 | 0.00 | 0.00 | 0.00 | 0.00 |
Isothermal titration calorimetry (ITC)
| Protein | [P] (µM) | [L] (µM) | Kd (nM) | ΔHobs (kcal/mol) | N | TΔS (kcal/mol) | ΔG (kcal/mol) |
|---|---|---|---|---|---|---|---|
| BRD2(1) | 225 | 25 | 128.4 ± 6.5 | -7.74 ± 0.003 | 1.02 ± 0.002 | 1.35 | -9.08 |
| BRD3(1) | 306 | 25 | 59.5 ± 3.1 | -6.57 ± 0.017 | 1.07 ± 0.002 | 2.97 | -9.54 |
| BRD3(2) | 280 | 30 | 82.0 ± 5.3 | -4.93 ± 0.017 | 1.03 ± 0.002 | 4.41 | -9.35 |
| BRD4(1) | 240 | 25 | 49.0 ± 2.4 | -8.42 ± 0.019 | 1.00 ± 0.001 | 1.22 | -9.64 |
| BRD4(2) | 250 | 27 | 90.1 ± 4.6 | -3.22 ± 0.009 | 1.06 ± 0.002 | 5.76 | -9.29 |
| BRDT(1) | 305 | 25 | 190.1 ± 7.6 | -8.30 ± 0.024 | 1.06 ± 0.002 | 0.56 | -8.86 |
| CREBBP | 950 | 30 | nd | nd | nd | nd | nd |
| WDR9(2) | 300 | 25 | nd | nd | nd | nd | nd |
Nd: not detected
CEREP Assay

Displacement of a tetra-acetylated histone H4 peptide by JQ1/SGCBD01 isomers using BRD4(1), BRD4(2) or of an acetylated H3 peptide using CREBBP.

Thermal melting experiments were carried out using an Mx3005p Real Time PCR machine (Stratagene). Proteins were buffered in 10 mM HEPES pH 7.5, 500 mM NaCl and assayed in a 96-well plate at a final concentration of 2 µM in 20 µl volume. Compounds were added at a final concentration of 10 µM. SYPRO Orange (Molecular Probes) was added as a fluorescence probe at a dilution of 1:1000. Excitation and emission filters for the SYPRO-Orange dye were set to 465 nm and 590 nm, respectively. The temperature was raised with a step of 3 °C per minute from 25 °C to 96 °C and fluorescence readings were taken at each interval. The temperature dependence of the fluorescence during the protein denaturation process was approximated by the equation
where ΔuG(T) is the difference in unfolding free energy between the folded and unfolded state, R is the gas constant and yF and yU are the fluorescence intensity of the probe in the presence of completely folded and unfolded protein respectively. The baselines of the denatured and native states were approximated by a linear fit. The observed temperature shifts, ΔTmobs, were recorded as the difference between the transition midpoints of sample and reference wells containing protein without ligand in the same plate and determined by non-linear least squares fit.
Experiments were carried out on a VP-ITC titration microcalorimeter from MicroCalTM, LLC (Northampton, MA). All experiments were carried out at 15 °C while stirring at 295 rpm, in ITC buffer (50 mM HEPES pH 7.4 at 25 °C, 150 mM NaCl). The injection syringe (250 µl) was loaded with a solution of the protein sample (300 µM protein for the BETs, 950 µM protein for CREBBP and 600 µM for WDR9(2), in ITC buffer). All titrations were conducted using an initial injection of 2 µl followed by 34 identical injections of 8 µl with a duration of 16 sec (per injection) and a spacing of 250 sec between injections. The heat of dilution was determined by independent titrations (protein into buffer) and was subtracted from the experimental data. The collected data were implicated in the MicroCalTM Origin software supplied with the instrument to yield enthalpies of binding (ΔH) and binding constants (KB) as previously described by Wiseman and coworkers50. Thermodynamic parameters were calculated (ΔG = ΔH - TΔS = -RTlnKB, where ΔG, ΔH and ΔS are the changes in free energy, enthalpy and entropy of binding respectively). In all cases a single binding site model was employed.
JQ1/SGCBD01 (1 µm) was screened against a panel of 55 ligand receptors, ion channels and transports using an established and widely utilized commercial assay platform (ExpresSProfile; CEREP, Paris, FRANCE).
All reagents were diluted in 50 mM HEPES, 100 mM NaCl, 0.1 % BSA, pH 7.4 supplemented with 0.05 % CHAPS and allowed to equilibrate to room temperature prior to addition to plates. A 24-point 1:2 serial dilution of the ligands was prepared over the range of 150–0 µM and 4 µl transferred to low-volume 384-well plates (ProxiPlateTM-384 Plus, PerkinElmer, USA), followed by 4 µl of HIS-tagged protein (BRD4(1), 250 nM, BRD4(2) and CREBBP, 2000 nM). Plates were sealed and incubated at room temperature for 30 minutes, before the addition of 4 µl of biotinylated peptide at equimolar concentration to the protein [peptide for BRD4(1) & BRD4(2): H4K5acK8acK12acK16ac, H-SGRGK(Ac)GGK(Ac)GLGK(Ac)GGAK(Ac)RHRK(Biotin)-OH; peptide for CREBBP: H3K36ac, Biotin-KSAPATGGVK(Ac)KPHRYRPGT-OH. Plates were sealed and incubated for a further 30 minutes, before the addition of 4 µl of streptavidin-coated donor beads (25 µg/ml) and 4 µl nickel chelate acceptor beads (25 µg/ml) under low light conditions. Plates were foil-sealed to protect from light, incubated at room temperature for 60 minutes and read on a PHERAstar FS plate reader (BMG Labtech, Germany) using an AlphaScreen 680 excitation/570 emission filter set. IC50 values were calculated in Prism 5 after normalization against corresponding DMSO controls and are given as the final concentration of compound in the 20 µl reaction volume.
Fluorescence recovery after photobleaching (FRAP) of GFP–BRD4 demonstrates enhanced recovery in the presence of JQ1/SGCBD01. Nuclei are false-coloured in proportion to fluorescence intensity. White circles indicate target regions of photobleaching (left panel). The kinetics of the fluorescence recovery of JQ1/SGCBD01 treated cells (red) and control (black) is shown in the panel in the middle and recovery rates are shown at the right panel. Data represent the mean ± s.d. (n = 5), and are annotated with P-values as obtained from a two-tailed t-test.

JQ1/SGCBD01 prompts squamous differentiation, growth arrest and apoptosis in vivo, as determined by IHC. Histopathological analysis of NMC 797 tumors excised from mice treated with JQ1 (right panel) reveals squamous differentiation (H&E), effacement of nuclear NUT foci (NUT), impaired proliferation (Ki67) and induction of keratin expression all as compared to vehicle-treated animals. Animals were treated once a day (50mg/kg, IP) using the racemic mixture of JQ1/SGCBD01

FRAP studies were performed on U2OS cells transfected (lipofectamine; Invitrogen) with mammalian overexpression constructs encoding GFP chimera with BRD4, NUT and BRD4-NUT. A 5 µm2 nuclear region was bleached with high laser intensity in one cell within each field, and measured for recovery with low laser intensity and a 150 µm pinhole. Images of identical fields were acquired using a Nikon C1 Plus confocal microscope equipped with a 37 °C heated chamber and FRAP modules. Average intensities of the bleached region were measured over time and using MetaMorph v7, and normalized to an independent region of interest before bleaching. Data were then analyzed to assess the time to half-maximal fluorescence recovery and the mobile fraction in Microsoft Excel Mac 12.2.4.
Immunohistochemistry was performed using the Aperio Digital Pathology Environment (Aperio Technologies, Vista, CA) at the DF/HCC Core Laboratory at the Brigham and Women’s Hospital. Slides were scanned in an automated fashion on a ScanScope XT Instrument at 20x resolution with the ScanScope Console v10 (Aperio Technologies). Digital images were remotely analyzed using ImageScope (Aperio Technologies). IHC images were exported as high-resolution TIFF files with comparable settings for paired data.
Main features